Tomoko Kodama Kawashima, Eri Osawa, Etsuji Okamoto y Hiroko Miura
Introducción: La experiencia del paciente se enfatiza más en el contexto de la seguridad del paciente y la atención centrada en el paciente. Es un componente crucial en la evaluación de la calidad de la atención médica. En Japón, la Encuesta de Experiencia del Paciente (PES) se ha realizado a nivel nacional en intervalos de tres años desde 1996. Revisamos la satisfacción general de los pacientes en series temporales y examinamos los factores asociados con ella.
Métodos: Se utilizaron datos de fuentes abiertas de PES de 1996 a 2011 para encontrar cambios en series temporales en la satisfacción general de los pacientes. Para el análisis transversal, examinamos los factores que influyen en la satisfacción de los pacientes utilizando datos originales de PES de 2005. Se calculó el alfa de Cronbach para examinar la fiabilidad de siete preguntas sobre la satisfacción de los pacientes. Se utilizó un análisis de regresión logística ajustado por edad y sexo para examinar las asociaciones con la satisfacción de los pacientes y otros factores.
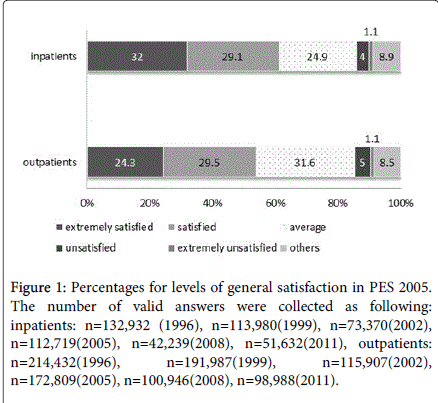
Resultados: Las tasas generales de satisfacción general (extremadamente satisfecho y satisfecho) aumentaron gradualmente del 53,7% al 64,7% entre los pacientes hospitalizados, pero el aumento fue menor entre los pacientes ambulatorios del 48,1% al 50,4%. Siete preguntas sobre la satisfacción del paciente en el cuestionario para pacientes hospitalizados y ambulatorios, se confirmó una alta confiabilidad con alfas de Cronbach de 0,895 y 0,863, respectivamente. La puntuación media más alta se encontró en la satisfacción con la atención proporcionada por la enfermera. La satisfacción general de los pacientes estaba altamente relacionada con la satisfacción en la buena comunicación con el médico (coeficiente de correlación de Pearson; r = 0,650, p < 0,01). Entre los pacientes ambulatorios, la satisfacción con el costo que los pacientes pagaron el día de la visita tuvo coeficientes de correlación más pequeños en comparación con otras variables de satisfacción (r = 0,255-0,294). El respeto a la autonomía (se respetó la decisión del paciente sobre el tratamiento) tuvo una asociación positiva con la satisfacción del paciente (β=0,152, SE=0,031, p<0,001) y la incertidumbre sobre la seguridad del paciente tuvo una asociación negativa con la satisfacción del paciente (β=-1,512, SE=0,052, p<0,001).

Figura 1: Porcentajes de los niveles de satisfacción general en el PES 2005. El número de respuestas válidas recogidas fueron las siguientes: pacientes hospitalizados: n=132.932 (1996), n=113.980(1999), n=73.370(2002), n=112.719(2005), n=42.239(2008), n=51.632(2011), pacientes ambulatorios: n=214.432(1996), n=191.987(1999), n=115.907(2002), n=172.809(2005), n=100.946(2008), n=98.988(2011).
Conclusión: La satisfacción general de los pacientes se ha mantenido estable o ha mejorado ligeramente a lo largo de 15 años. Se debe reconocer nuevamente la buena comunicación con el médico, el respeto a la autonomía y la seguridad del paciente para mejorar la satisfacción del paciente.
Comparte este artículo